-
3952 SNOWGOOSE Street
Simi Valley, CA 93065$2,175,000
- 6
- 7
- 5910
- Active
- 215007241
Stunning French Country Estate in Prestigious Big Sky!! Custom new construction sgl story, unparalleled in quality & detail. Nestled on 3.6 acres beh... -
685 NOBLE Road
Simi Valley, CA 93065$1,295,000
- 5
- 5
- 4112
- Active
- SR15103499
ESTATELY ELEGANCERelax and enjoy your private life in this 4,111 sq.ft. Morrison Highland Estate home.Built in 2000, with its 5 generous bedrooms, a h... -
109 HIGHLAND Road
Simi Valley, CA 93065$1,125,000
- 4
- 4
- 2982
- Active
- 215007280
Beautiful SINGLE STORY home! Located in an exclusive area on a wonderful sweeping corner lot.The property has lovely curb appeal & when you open the f... -
5079 WESTWOOD Street
Simi Valley, CA 93063$1,074,997
- 5
- 5
- 4573
- Active
- SR15102108
Welcome to the Villa Tuscana model in the Executive homes of Encantada located in the Wild Horse Canyon development. This 4,573 square foot, 5 bedroom... -
776 LARCHMONT Street
Simi Valley, CA 93065$974,900
- 5
- 4
- 3404
- Active
- 215007007
Light, bright, charming and elegant.This home has it all.The entry welcomes you with gorgeous distressed wood floors.Two story windows filter light th... -
391 HILL VALLEY Court
Simi Valley, CA 93065$869,000
- 4
- 4
- 2780
- Active
- SR15103764
Gorgeous home located in the 24 hour guard gated Long Canyon Estates This open and bright home offers 4 bedrooms, 4 baths and 2,780 sq feet, dramatic ... -
661 EISENHOWER Way
Simi Valley, CA 93065$834,900
- 5
- 3
- 2844
- Active
- 215007159
Craftsman home nestled in exclusive Rancho Madera adjacent to the Reagan Library & Air Force One. Enjoy private quiet living without giving up modern ... -
1268 KING PALM Drive
Simi Valley, CA 93065$742,900
- 5
- 4
- 3205
- Active
- 215007410
Spectacular Heather Hills family home with private cul-de-sac location enjoys mountain views. This beautiful 5 bedroom, 4 bath home with 1 bedroom/ful... -
5529 MICOMA Court
Simi Valley, CA 93063$725,000
- 4
- 2
- 2085
- Active
- 215007100
Truly Exquisite, single story, 4 bedroom, 3 bath home with over 2000 SF with Pool & Spa on a double ended cul-de-sac! Prime Simi location, close to Si... -
2619 SUNSHINE VALLEY Court
Simi Valley, CA 93063$699,900
- 5
- 3
- 2537
- Active
- 215007407
Lovely White Oak Creek 5 Bed, 2.5 Bath pool home featuring a tile entry, an OPEN LIVING & DINING ROOM, a kitchen w/a DOUBLE OVEN, under-cabinet lighti...
Showing posts with label Simi Valley Short Sale Help. Show all posts
Showing posts with label Simi Valley Short Sale Help. Show all posts
Wednesday, May 20, 2015
Simi Valley Luxury Home Specialist What Is For Sale In Simi Valley
 View
Photos
View
Photos View
Photos
View
Photos View
Photos
View
Photos View
Photos
View
Photos View
Photos
View
Photos View
Photos
View
Photos
 View
Photos
View
Photos View
Photos
View
Photos View
Photos
View
Photos View
Photos
View
Photos


Simi Valley Real Estate Market Updates #ChrisBJohnsonRealtor

Chris B Johnson, REALTOR®
Simi Valley Home Market Trends
Simi Valley Condo-TownHome Market Trends
Ventura County Trends
Ventura County Neighborhood Values and Reports
Price Trends - Sold vs.
Listed
Understand the difference between "listing prices" (what sellers are asking
for) and "sold prices" (what buyers are willing to pay).
By comparing these price trends, you'll have a good idea of where the market is heading. The median listing and sold property prices are calculated based on the market activity each month.
By comparing these price trends, you'll have a good idea of where the market is heading. The median listing and sold property prices are calculated based on the market activity each month.
Some sales are not immediately available from
public records. As they become available, the data are
updated.

Market Inventory
Trends
The number of active listings in Simi Valley (93065) dropped by
1.8% from the previous month.
The median number of days active properties have been listed is 36. This is significantly shorter than the national average.
The number of sales in March dropped by 95% from the previous month.
The median number of days active properties have been listed is 36. This is significantly shorter than the national average.
The number of sales in March dropped by 95% from the previous month.

Property Ownership
The percent of unoccupied properties is very low in Simi Valley (93065) . It
is -12.08% below the national average.

Wednesday, January 14, 2015
Simi Valley Short Sale, 4 Reasons You Should Sell Your Home Right Now
.png)
Simi Valley Short Sale,
Moorpark Short Sale
Ventura County Short Sale,
Thousand Oaks Short Sale,

Many Ventura
County Homes Appreciated by
over 26%
In The Last 2 Years. If you’re thinking
of selling, yours may have now have enough equity to sell without being “Short”. Pricing your home correctly the FIRST
TIME is more important than ever! If you want an accurate idea of what your home is worth Click Here:
You
may now have enough EQUITY in your home to sell WITHOUT having to be
“short”. If you are thinking about a short sale I can help you get an accurate value for your home and get back on your feet.
If you would like
periodic updates on what is going on in Your
Neighborhood or the Ventura County Real Estate Market, Click on the Links!
Thanks for reading
this,
Phone:
805-208-0823.
Is Residential Real Estate Really a
‘Crapshoot’? Why Do Over
2/3’s Of All Chapter 13 Bankruptcy’s Fail?
Simi Valley Short Sale Specialist, 30 years of summer, followed by 30 years of winter.

The 10-year Treasury note is at 2.08% in January 2015. This is up from a cyclical low of around 1.5% in mid-2012. Interest rates rise and fall in a cycle, and the current rising trend is the beginning of two or three decades of rising interest rates. This will dampen home price increases, as buyer purchasing power is continually reduced.
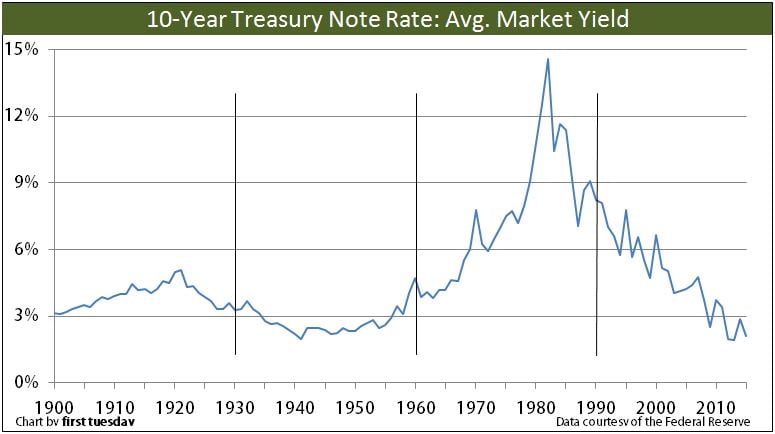
Bond market cycles
The average monthly 10-Year Treasury Note (T-Note) yield since 1900 is shown on the chart above. As demonstrated, interest rates on the 10-Year T-Note have shown an overall decline since 1980, following a rise from lows last reached in 1941.
We can now see that 1940-1950 marked the beginning of what has become a 60-year rates cycle: approximately 30 years of rising rates, followed by 30 years of falling rates. This roughly mirrors the 60-year period prior to 1950, in which interest rates peaked in 1921.
Looking forward to the next 60-year rate cycle, first tuesday expects another slow upward run in rates for 20-30 years, and then a reversal into rate declines as occurred following 1980.
The interest rate on the 10-Year T-Note dropped as low as 1.47% in early June 2012 as the euro, the renminbi, and the Brazilian real all weakened against the U.S. dollar. These lows were extreme and are evidence of international monetary stress.
Mortgage rates have historically moved in tandem with the 10-year T-note at a 1.4% spread. However, this 1.4% spread has been elevated – at around 1.5-1.7% – since 2012. This indicates that despite the historically low mortgage rates experienced in these past couple years, homebuyers are overpaying for loans.
As we head into 2015, 10-year T-notes have dropped slightly but continue their long rise. The upcoming period of rising rates is likely to last for quite a long time – two or three decades.
The last three cycles in bond market rates have been extremely regular, points out Chris Watling of Longview Economics. A 27-year downtrend in rates (1922-1949), followed by a 32-year uptrend (1949-1982) and another 31-year downtrend lasting to the present. While the regularity of this pattern of 30-year passages should be considered coincidental (they very easily might have been forty years, or twenty), precedent establishes that bond market rate changes are much slower and more gradual than, say, changes in the stock market.
Related article:
Current market rates
Interest rates and asset pricing
In previous interest rate cycles, rates rose for approximately thirty years, peaking in 1921 and again in 1979 after rising from essentially zero in the late 1940s, following the recovery from the Great Depression.
In 1947, at the end of World War II, interest rates on the 10-year T-Note were near zero, much as they are today. Then, from 1947 to1979, rates moved steadily upward.
1947 is a key year for other reasons as well: it marked the end of a recession, and a long-awaited return to prosperity after the Great Depression of the late-1930s. If this interest rate pattern holds true, as first tuesday believes it will, we now find ourselves at the beginning of a reversal in the real estate market comparable in type, if not in intensity, to the turnaround after 1947.
During the resulting half cycle of rising interest rates from 1949 to 1982, the wealth of investors increased even as interest rates rose, housing construction was very strong and employment and prosperity increased as well. The American Dream of jobs, cars and homes for all was in full bloom during this period. We expect to experience similar conditions during the two or three decades, into the mid 2030s – once we get out of this extended recovery period (this time, hopefully without the stimulus of a war effort).
For the housing market, however, rising interest rates, even static interest rates, mean that there will be no short-term profits to be had from any increase in pricing. The notorious “Greenspan Put,” which we have grown accustomed to seeing after every drop in interest rates, will not and cannot be repeated to artificially generate profits in any asset market – commodities, stocks, bonds or real estate.
Mortgage rates are inextricably tied to bond market rates, and every increase in bond and mortgage rates means a decrease in a homebuyer’s purchasing power – the amount they can borrow based on repayment at 31% of income – and an increase in the earnings of the rentier class. Thus, a buyer will experience a decrease in the amount they can pay for a home.
Less money borrowed by homebuyers means less price received by sellers for their properties. Of course, this annual decrease in purchasing power is fully offset in actual (nominal) dollar terms by the Fed’s monetary policy, which maintains annual inflation around 2%. This inflation is the driving force increasing wages from year to year.
As in the period of rising bond and mortgage rates from 1949-1982, prices will be held down, rising only in response to consumer inflation as permitted by the Fed and any “price appreciation” at the property’s location (appreciation occurs solely due to demographics, as demand for real estate within an area increases with a rise in the area’s population density or an increase in the income of that population beyond the rate of inflation). [For more in price evaluation, see thefirst tuesday Income Property Brokerage (IPB) suite of forms]
Related articles:The Economist: The cycle turns
Interest rates in the modern day
The Fed ceased its final round of quantitative easing (QE3) in October 2014, promising to keep the short-term interest rate low (around 0.25%) until the economy improves sufficiently. They will likely raise interest rates by the end of 2015, or perhaps in early 2016. The 30-year FRM rate will increase in anticipation of the Fed’s increase of the short-term rate, the beginning of the next 20-30 years of rising mortgage rates.
When rates rise, agents will quickly learn to cope with an unfamiliar set of investment and pricing challenges (including different income multiplier/capitalization rates, long-term holding periods before profits can be taken, and Due-On Sale clause assumptions).
The key lesson to remember in those upcoming years will be that real estate is most properly priced and held for its inherent rental value. Those who buy property for speculative gain, not rental income, will see as little success in gains from a flip as those who invested in the real estate market from 1950 to 1980, when mortgage rates moved slowly, steadily upward until they exceeded 18%.
The next peak in rates, whether or not they reach past heights, will likely take another 30 years to arrive. But this cycle’s days of steadily decreasing interest rates, accompanied by steadily falling rents, producing ever increasing prices and profits (and §1031 hysteria) have run their course to the bitter end.
Related articles:
In the last two decades, it was possible to purchase a parcel of real estate, vacant or improved, and take a profit, much greater than the rate of consumer inflation, merely by holding that parcel for a short period of time. This is no longer an option. Prices may rise in narrowly defined locations enjoying a population density explosion, but most will be dampened by constantly rising interest rates which will keep prices from rising faster than the rate of core inflation.
The negative pricing effects of increasing interest rates can be at least in part counterbalanced by improved zoning. If property prices rise beyond the rate of inflation, local governments will have to permit density to increase to accommodate those who are attracted to the area or suffer the consequences of an asset inflation bubble. Smart investors will look to purchase property in urban centers which have already begun to establish themselves as the most desirable abodes for the next generation of homeowners and tenants.
In the long run, investors in real estate will need to increase their wealth, not by flipping their properties for profit, but by generating rental income over the course of long-term ownership. Income property will be bought to be operated and managed for an annual net operating income, capitalizing at the rate proper going forward.
In boom times, property owners were accustomed to capitalization rates (cap rates) of 6% or less. For upcoming years, 10% may be more normal. Prudent property selection, careful research, forward looking capitalization rates and a long-term commitment to real estate ownership will be the keys to success in the new paradigm.


About The Author

ft Editorial Staff
is the writing staff comprised of legal editor Fred Crane, In-House Broker Consultant Fernando Nunez and writer-editors Connor P. Wallmark, Giang Hoang-Burdette, Carrie B. Reyes, Matthew Taylor and Sarah Kolvas, and graphic designer Mary LaRochelle.
Subscribe to:
Posts (Atom)