Showing posts with label Ventura County Short Sale Specialist. Show all posts
Showing posts with label Ventura County Short Sale Specialist. Show all posts
Saturday, May 21, 2016
Saturday, October 10, 2015
Simi Valley Real Estate Market Values and Trends #ChrisBJohnsonRealtor
|
|
|||||||||||||||||||||||||
|
|
||||||||||||||||||||||||
|
This message was sent on behalf of Chris B. Johnson at Allison
James Estates & Homes Elite
|
|||||||||||||||||||||||||


Tuesday, January 27, 2015
Ventura County Loan Modification HELP!! Will HAMP Borrowers Absorb Higher Payments When Mods Reset?..or Default #ChrisBJohnsonRealtor
.png)
By Chris B Johnson Realtor, Ventura County Short Sale,
The clock is ticking...Approximately half a million homeowners who received a mortgage loan modification in 2010 through the government's Home Affordable Modification Program, commonly known as HAMP, are due to reset in 2015 – and those homeowners will be facing slowly increasing monthly mortgage payments.
Will these homeowners be able to handle the payment increases, or will there be a massive wave of re-defaults?
The U.S Department of Treasury and Department of Housing and Urban Development (HUD) launched HAMP in 2009 as part of its Making Home Affordable initiative to provide relief for homeowners facing financial hardship by reducing monthly payments to affordable levels through lowered interest rates and modified loan terms. The goal of the modifications was to reduce monthly payments to about 31 percent of the homeowner's income. According to Mark McArdle, Chief Homeownership Preservation Officer at Treasury, HAMP has saved distressed homeowners an average of about $547 per month (about 39 percent) on mortgage payments by lowering their interest rate in many cases to 2 percent.
Thinking
about a loan modification? Our Ventura county Loan Modification kit has the
instructions you will need to get a loan modification approved with your bank. Click
here to request a copy.
There are some who are not sold on the effectiveness of HAMP. One of those is Bankrate.com Chief Financial Analyst Greg McBride, who said in 2009 that homeowners receiving a modification through HAMP were simply "kicking the can down the road" and now that we are in 2015, "we're at the end of the road" because of all the HAMP mods due to reset this year. Furthermore, he said he thinks many homeowners will be "shocked" to find out that "permanent didn't really mean permanent" and instead meant five years.
"What happens is that payment starts to normalize – that 2 percent increases by 1 percentage point per year," McBride said. "So what's going to happen is these homeowners are going to see their mortgage payments go up this year, next year, and in many cases, the year after that. That's where the potential problem is. Household incomes have been stagnant and many homeowners don't have the additional room in their budget to absorb higher payments. Even if they can absorb the first payment increase, the cumulative increase of payments in subsequent years could prove problematic."
Just how problematic will the interest payment increases be? That remains to be seen, but even without the interest increases, re-default rates on HAMP mods have hovered around 40 percent for mods with a 2010 vintage.
As of the end of Q3 2014, the latest data available, HAMP has helped about 1.4 million distressed homeowners receive permanent loan modifications. Of the approximately 60,000 permanent modifications completed in 2009, the first year of HAMP, about 42 percent of those modifications were 90 or more days delinquent 42 months after the modification became permanent. Of the nearly 511,000 HAMP modifications with a vintage of 2010, that percentage was about the same for those with a 2009 vintage – about 41 percent. That is double the percentage of overall 90-day delinquency rate of all HAMP mods completed through the second quarter of 2013, which is 20 percent.
Treasury has been considering the possibility of re-defaults on HAMP mods and has ways of helping those borrowers for years.
"In addition, we are looking at whether financial counseling for borrowers at the beginning of a modification can be effective in reducing re-default risk," McArdle wrote in 2013. "While re-default remains an unfortunate outcome for some borrowers, clearly without HAMP, national foreclosures rates would have been much higher and many borrowers would not have received the assistance they needed. HAMP continues to be the strongest available program for mortgage modifications. Receiving assistance through HAMP gives homeowners a valuable opportunity to strengthen their financial footing and stay in their homes."
McArdle said that only a small percentage of borrowers who re-default on HAMP mods actually go into foreclosure. Many who re-default are later able to find solutions to avoid foreclosure.
"Of those homeowners who have not been able to keep up with their modified payments under HAMP, the majority have received other forms of assistance or reinstated or paid off their mortgage loans," McArdle wrote. "HAMP requires servicers to reach out to any homeowner who falls behind on a modification to review all other assistance options, before the servicer starts foreclosure proceedings."
Many Ventura
County Homes Appreciated by
over 26%
In The Last 2 Years. If you’re thinking
of selling, yours may have now have enough equity to sell without being “Short”. Pricing your home correctly the FIRST
TIME is more important than ever! If you want an accurate idea of what your home is worth Click Here:
You
may now have enough EQUITY in your home to sell WITHOUT having to be
“short”. If you are thinking about a short sale I can help you get an accurate value for your home and get back on your feet.
If you would like
periodic updates on what is going on in Your
Neighborhood or the Ventura County Real Estate Market, Click on the Links!
McArdle is scheduled to be a panelist on the "Modifying Modifcation" panel at the upcoming Five Star Government Forum in Washington, D.C. on March 18. This panel will assess HAMP and its effect on stabilizing the housing market and assisting distressed homeowners.
With regard to the possibility of re-default, McArdle said Treasury is ready.
"Treasury will maintain its oversight of participating servicers," McArdle said in a note to servicers last March. "We will monitor the interest rate resets to ensure that if signs of homeowner distress arise, servicers are ready and able to help by providing loss mitigation options and alternatives to foreclosures."
McBride said although there will be HAMP re-defaults, it will likely not trigger a housing bust similar to the one the country experienced seven years ago.
"The numbers aren't that big relative to what we saw during the housing bust and it's spread out over a period of several years, so it's not coming all at once," McBride said.
Thursday, November 20, 2014
Ventura County Short Sale-How to time the real estate market

Everyone wants to know the best time to buy, sell or hold real estate. Three factors, explained in the charts below, help you anticipate the best action for 2014 and beyond. These factors strongly suggest home price gains have topped out.
Today’s yield spread is near the highest it’s been since 2011. However, a high yield spread on its own is not enough to signal future prosperity for the housing market.
Home sales volume experienced no long-term change from 2009 to 2013, but has since decreased in 2014. Home prices are still riding high on a wave of speculator activity as of Q3 2014, but the rise has decelerated quickly. Home prices began to fall at the end of Q3 2014, and they are expected to continue falling in the coming months, bottoming in 2015. Home pricing won’t likely return to today’s speculator-driven levels until the next peak in pricing, expected in 2019-2020.
Today’s mixed signals of a high yield spread, low sales volume and inflated prices indicate today is a hold phase for real estate investors.
Chart 1
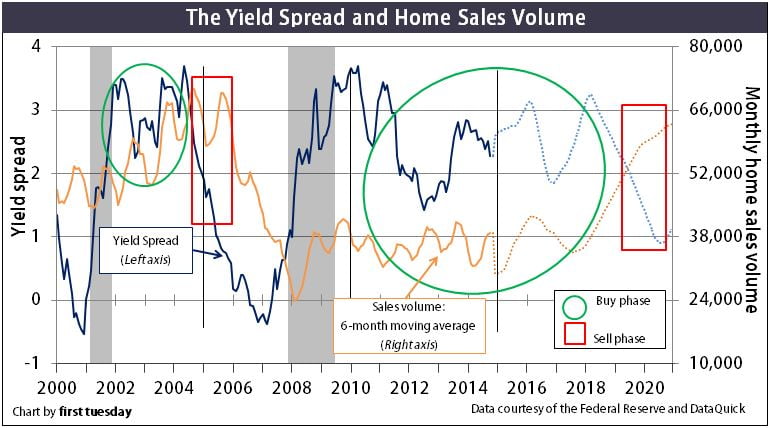
Chart update 11/13/14
| Oct 2014 | Sep 2014 | Oct 2013 | |
| Yield spread | 2.28 |
2.51
| 2.54 |
| Home sales volume | 36,830 | 36,316 | 36,468 |
There is a 1-month reporting delay for home sales volume data.
Chart 2
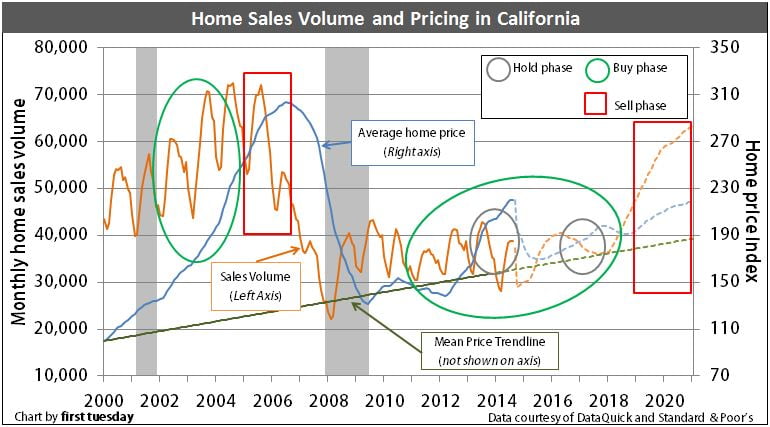
Chart update 11/13/14
| Aug 2014 | July 2014 | Aug 2013 | |
| Home sales volume | 37,228 | 39,608 | 42,546 |
| Average home price movement | 220 |
220
|
197
|
There is a 1-2 month reporting delay for pricing and home sales data.
These market charts are your investment planner. They tell you when a business cycle will enter a buy phase, sell phase or hold phase.
To buy or sell in 2014?
The best action for today’s housing market can be found by examining three factors:
- the yield spread (which forecasts future economic performance one year hence and is the difference between the 10-year Treasury Note and the 3-Month Treasury Bill rates);
- home sales volume (which forecasts home price movement nine months hence); and
- home pricing (the crucial factor of whether rent, (as a base for applying a capitalization rate a prudent investor will use to discount future Net Operating Income (NOI)), supports current pricing).
The situation:
As of October 2014, the yield spread was 2.28, down from 2.54 one year earlier. While today’s yield spread is near the highest it has been since 2011, it’s not enough to signal future prosperity for the housing market. A slightly more vigorous general economic recovery in the next 12 months is likely, but today’s meager home sales volume and inflated home prices portends a flat housing market for the remainder of 2014.
As depicted in Chart 2, home sales volume has shown dramatic change from quarter to quarter, but little long-term change since 2009. Total sales in 2013 were virtually level with 2012, and only 4% lower than the stimulus inflated year of 2009.
As of August 2014, home sales volume was 12.5% lower than one year earlier — not exactly what is meant by a recovery. This continues the trend of a relatively flat year for sales volume, all part of the bumpy plateau recovery first tuesdaypredicted five full years ago. A falling sales volume forecasts flat-to-falling pricing nine months hence.
Likewise, if sales volume is rising rapidly, home prices will soon also rise quickly, with a lag period of around six months.
However, speculator interference in 2012-2013 distorted price movement, causing an unsustainable price bump for lack of anything resembling sufficient end user demand. In fact, home prices were a full 26% higher in February than one year earlier in the low tier of California home sales. This price bump is not the same as a buy or sell phase. The current price bump is unsupported by sales volume, and is expected to deflate by Q3 2014, approximately 9-12 months after home sales volume began to slip (in November 2013).
Price bumps are often misconstrued as cycles in and of themselves. However, they are merely the result of frenzied speculator attitudes in momentum markets to buy low and sell high within a matter of months. These short bursts in rising prices are unpredictable. You are better off not attempting to apply the factors influencing buy and sell phases to these short periods.
How can you tell the difference between a price bump and a more sustainablebuy phase? Price bumps are characterized by:
- no long-term rise in the yield spread;
- no corresponding, long-term increase in sales volume; and
- unusual market factors, such as an increased speculator presence or percentage of ARM loan originations.
Home sales volume remained level with the previous year in 2013. Still, prices remain above the historical mean price for this cycle.
This suggests prices must fall, or – more likely – remain level for several years. When home prices eventually match up with mean pricing, prices will rise at the rate of consumer inflation for the next 10 years or so. Prices never follow the mean price trendline precisely. However, they are magnetically drawn to the mean price point, oscillating above and below due primarily to personal income levels and mortgage rates. Prices will likely slip to touch the trendline in 2017-2018 and rise to the next peak in 2020.
Related article:
Long-term investors will hold onto their property until a future sell phase, when home values have had more time to appreciate. Little asset appreciation will occur between now and 2015 as property prices slip to another bottom.
The continuing buy phase
When asked if today is a good time to buy real estate, consider this:
- prices will not increase beyond today’s speculator-driven levels until the next peak in pricing, likely around 2018-2020, possibly later.
However, today’s price bump does not constitute a sell phase. It is too brief and unpredictable, as it is not sustained by sales volume or yield spread movement. Rather, when the yield spread, sales volume and pricing display mixed signals, this constitutes a hold phase.
As soon as the yield spread and home sales volume pick up for an elongated period (around 6 months) and prices remain low, the buy phase is on.
This elongated buy phase will likely pick up momentum following a rise in mortgage rates upon a full recovery in the job market, likely in 2016–2017.
The Boomer generation will begin to retire in earnest by 2018 and members of Generation Y will then be entering the housing market in ever greater numbers. This period will be a mini-boom, as property changes hands between Baby Boomers and our nation’s migrants and the next generation of first-time homebuyers. Also, the displaced homeowners of today in some small part will buy again when general optimism returns.
For those who have real estate they would like to sell, all these signs suggest 2014 (and most likely 2015-2016) is a hold period. Current owners should hold their properties until increased employment creates demand (and higher prices, if builders are not permitted to meet the growth in demand due to zoningregulations).
Those who wish to buy may have already missed their most recent best opportunity. The buy window is not yet closed, but current speculator interference continues to disrupt the market. This speculator-driven price rise is not permanent. As the entry of flippers tapers off in the market in early 2014, the pricing frenzy seen today will cool down. Better, homebuyer occupants will begin their cautious re-entry into the market with slowly rising confidence and job numbers. However, this gradual re-entry means prices will remain mostly level through 2016, rising only with the rate of inflation, as seen on Chart 2.
Related articles:
Advanced charting: Buy, sell or wait out the market
The economy moves in cycles. The length of a cycle is determined by the extent and duration of economic excesses and recesses during the cycle.
Today, the 2008 recession and financial crisis combined with zero-bound interest rates will draw out the present recovery cycle for several years beyond the norm. The current cycle from which we are emerging — 2001-2009 — had unprecedented levels of excess and recess.
Each real estate market cycle can be neatly divided into three phases:
- The Buy Phase: the ideal moment for buying property is the start of the recovery. This phase is characterized by:
- cyclically low prices;
- low interest rates; and
- few willing buyers;
- The Hold Phase: the phase following a purchase during the buy phase or a sale in the sell phase, can be the longest time period in the cycle. Prudent investors patiently bide their time, awaiting the boom or bust to play out before reentering to buy or sell; and
- The Sell Phase: this phase commences with a peak in sales volume. It is characterized by:
- rising prices;
- a drastic fall in the yield spread; and
- monthly reductions in sales volume.
The buy and sell phases each occur just once during a real estate cycle. The hold phase appears twice: once after the buy phase, and once after the sell phase.
The investor’s goal
The key to successful real estate investing is to look beyond the property’s annual operating income to the end goal: a sale. Whether on a quick flip or after a long-term buy-to-let period, the endgame is to profit on a resale. That is, to sell at a price appreciated beyond the price paid and consumer inflation.
For investors to sell for a profit, they first need to buy at the bottom of a market cycle — the buy phase. This is when property prices are closest to their historic mean price. [See Chart 2]
It is rarely, if ever, possible to identify the top or bottom of a market cycle until after it has already passed. However, studied effort makes it more likely.
Anticipating prices
How can prices be anticipated? Fortunately, prices are a lagging indicator of real estate activity. Several early signs indicate an approaching long-term price increase.
The yield spread is the first domino in a series of movements influencing the housing market. The yield spread is the difference between the long-term (10-year) and short-term (3-month) Treasury rates. It indicates economic performance one year forward. [See Chart 1]
The yield spread directly affects home sales volume 12 months forward. Thus, if you observe movement in the yield spread, you can successfully predict the direction of future home sales volume. Six months of consistent yield spread movement is long enough to create a trend.
Experience shows us that sales volume will follow in the same direction 12 months after the yield spread trend began. Until it reverses course to run with the yield spread, sales volume will continue on its previous downward or upward path.
In turn, home sales volume sets the level of prices another nine months forward. [See Figure 1]
Figure 1: Phases of the real estate cycle
Figure 1: Phases of the real estate cycle
| Yield spread increases for 6 months (prepare for buy phase) | 12 months pass from the start of the yield spread movement | Home sales volume begins to increase (buy phase begins) |
| Sales volume increases (buy phase continues) |
nine months pass from the start of the sales volume movement
| Home pricing increases (buy phase continues) |
| Yield spread decreases for 6 months (prepare for sell phase) |
12 months pass from the start of the yield spread movement
|
Home sales volume begins to decrease (sell phase begins)
|
| Sales volume decreases (sell phase continues) |
nine months pass from the start of the sales volume movement
|
Home pricing decreases (sell phase ends, hold phase begins)
|
The best way to demonstrate is with an example from our recent history.
1999-2002: hold phase
From 1999-2002, home sales volume declined annually even as home pricing continued its decade-long rise. The yield spread stood at an historic low, averaging 0.95 from 1999-2001. More importantly, it went negative (with short-term rates valued lower than long-term rates) for several months in early 2001. These conditions signaled an imminent recession.
When the Federal Reserve (the Fed) raises interest rates, their aim is to slow the market down. Fewer loans are made and sales volume slows within 12 months. However, the 2001 recession failed to fully materialize. It was unable to work its magic to cool the economy (and real estate prices) since the Fed prematurely bolstered the economy after September 11, 2001.
When the economy is deliberately slowed and delivers mixed signals, prudent investors hold onto their cash and their property. They neither buy nor sell.
2002-2004: buy phase
Once the yield spread initially increases for a period of roughly six months after a recession investors are to prepare for the beginning of a buy phase. This preparation includes researching location – where and what type of property the investor will buy – and price – how much they will pay.
The actual time to buy? Once the yield spread begins to waver at its peak, as in late 2001/early 2002. As can be seen in Chart 2, 2002 demonstrated upward price movement above the 2001 trough, increasing to its peak in 2005. After that, prices slipped, then plunged.
The buy phase continued from 2002 through 2004. Preferably, an investor would have bought early in 2002 and waited until 2005 to sell. This waiting game is strategic — wait too long and you may lose money. Or, sell too soon and you may receive less than the maximum return on investment (ROI).
2005-2006: sell phase
If prices have risen sufficiently for you to meet your profit goals and the economy is delivering signals that the buy period will soon end, sell. Sell periods are the shortest, quickest phases of the cycle.
The briefness of the sell phase is due to public pessimism. The general public is slow to trust the market (causing slowly rising prices) and quick to get out at the slightest hint of falling prices (causing a sharp price drop). Therefore, one ignores the signs of a sell phase at one’s peril: it will be over just as soon as it began.
Real estate prices continue to increase for about nine months after sales volume starts to drop. Prices rise beyond sustainable demand and sales volume declines further.
In 2005, both the peaks and low points for monthly home sales volume were lower than the previous year’s, the presage of a price drop nine months forward. This slip in home sales volume is the clearest indicator the sell phase is ending.
In 2006-2007, the price dropped abruptly, further accelerating within a matter of months. The time for selling preceding a drop is marked by general optimism about ever-increasing prices. New buyers arrive every day, but in fewer numbers, still expecting unlimited profits on a resale. These optimists are unaware of the quicksand beneath their feet.
A savvy investor can see the dramatic fall in home prices even before sales volume decreases. As soon as the Fed increases short-term interest rates for 6 months continuously, investors must prepare to sell.
The Fed began raising rates in August of 2004. The yield spread began its precipitous fall just ten months later. It then dipped below the 1.21 spread which portends a recession some 12 months on. On schedule, home sales volume fell in mid-2005. Nine months later in 2006, again on schedule, home prices peaked and began their nosedive.
When sales volume begins to flag, sellers must be ready to list if selling is the short-term goal. Investigating price levels for comparable properties determines an appropriate listing price, and the acceptable sale price. Equally as important, an investor can use this time to locate a broker or agent who will aggressively market the property, locate a buyer and close escrow.
Real estate is local
There are, of course, variations on these themes. Real estate demand is highly localized. Thus, a thorough knowledge of local economics is necessary to accurately pinpoint the real estate phases.
Even if the yield spread is continuously increasing, pockets of high loan-to-value ratio (LTV) mortgage debt and low-income buyers may blunt any future stable price increases. There just isn’t sufficient buyer-occupant demand. This situation is currently observed in Riverside, San Bernardino and much of the Central Valley.
Likewise, regional employment levels can either escalate or kill the profit-making aspects of a buy phase. After all, employment is the basis for a buyer’s ability to take out a mortgage and create demand for real estate. Thus, suburban locations have their own demand issues separate from coastal areas, where job opportunities are most abundant.
If employment is rising but prices are still low, it is time to prepare for a buy phase.
This is the time to:
- canvass your region and categorize local inventory.
- select where to buy, whom to work with and what type of properties to purchase (size, valuation-rent);
- investigate the local lenders and their rates, including getting pre-approved by multiple lenders; and
- consider short- and long-term ownership objectives, including what type of property (multi-family, SFR, vacation home, etc.) will meet your goals.
Related articles:
Risk of opportunities lost
It must be emphasized, of course, that it is ultimately impossible to determine the absolute best moment to take advantage of an economic boom or crisis. Those moments only become apparent in hindsight. In this article, we have identified historical moments of opportunity. However, our forecasted ideal times to sell and buy are only informed opinions, sometimes jokingly referred to as educated guesses. Facts and data can only be derived from the past.
The actual decision of whether to buy or not depends not only on the economy — which is highly localized — but also on the specific homebuyer, and the seller’s willingness to carry paper.
2014 and the following few years will not be times of untrammeled get-rich-quick investment opportunities. Nonetheless, if you have an eye for long-term market stability in real estate prices, you will be rewarded.
Related articles:
Think you have it figured out? Let us know when you think the next buy and sell phases will be and why you believe so in the comments below!


About The Author
ft Editorial Staff
is the writing staff comprised of legal editor Fred Crane, In-House Broker Consultant Fernando Nunez and writer-editors Connor P. Wallmark, Giang Hoang-Burdette, Carrie B. Reyes, Matthew Taylor and Sarah Kolvas, and graphic designer Mary LaRochelle.
Subscribe to:
Comments (Atom)